|
Visual C++ debugging tipsContents PreambleA lot of these tips come from a time where I have been using C++ at the lowest possible level (i.e. with almost no grade of abstraction). This was a design decision of the system architects of that time. In Non-Antique C++ all of the darn memory allocation and casting-from-hell-and-back problems can easily avoided by using normal (hell, not even modern) C++ idioms (RAII, anyone?). IntroductionThe main problem with fixing bugs is that you cannot really estimate how long it will take to fix them. Therefore it is obviously better to solve the easy bugs - the technical ones - fast and conc.entrate on the real bugs (logical errors). In fact, the technical bug fixing is rather straightforward. This is just a small collection of tips to aid with this "technical" bugfixing . They are specifically targeted towards MS VC6 (VC7 should be mostly compliant). Some tips are rather obvious but somehow not spread widely. Visual C++ is a rather powerful tool that allows quite a lot of tweaking for different configurations, so a lot of problems are due to misconfigurations (wrong runtime library).. For real life usage, a professional tool should be mandatory. Boundschecker, IBM Rational Purify, AQTIme or Memory Validator are quite impressive products. I have evaluated some of them and must say they are overally worth every cent. Saving money here is obviously a bad decision (which somehow reminds me of this ). That said, I have to admit: I am slightly wrong. The runtime debugging functionality in the Windows API really can do a lot. You can simply use it and get the basic stuff done. So here we go.. Memory leaksAs we all know, MFC has a nice functionality included that can be used to check for memory leaks. Basically, the functionality itself is in the C-Runtime and not limited to MFC, hidden in "crtdbg.h". You can use it in any kind of project - here's how it basically works
#include "crtdbg.h"
#include <vector>

// 1. this should go into every .cpp , after all header inclusions
#ifdef _WIN32
#ifdef _DEBUG
   #include <crtdbg.h>
   #undef THIS_FILE
   static char THIS_FILE[] = __FILE__;
   #define new       new( _NORMAL_BLOCK, __FILE__, __LINE__)
   #define malloc(s) _malloc_dbg(s, _NORMAL_BLOCK, __FILE__, __LINE__)
#endif
#endif

int main(int argc, char* argv[])
{
    // 2. at the beginning of our app we need this
    int tmpFlag = _CrtSetDbgFlag( _CRTDBG_REPORT_FLAG );
        tmpFlag |= _CRTDBG_LEAK_CHECK_DF;
    _CrtSetDbgFlag( tmpFlag );

    // create some leaks
    std::vector<int*> lstAllocs;
    for (int x=0; x<99; x++)
    {
        int* pInt = new int;
        lstAllocs.push_back( pInt );
    }
    return 0;
}
Basically you have to put in the #define block in every .cpp file after the header inclusions (in fact you should also use the corresponding calloc/realloc etc functions, but I simple included new and malloc here. As you can see, we are leaking some ints. And this is the output in our debug window after our application exited. (Some people provide a function for atexit() and manually dump the memory leaks there).
Loaded 'ntdll.dll', no matching symbolic information found.
Loaded 'C:\WINDOWS\system32\kernel32.dll', no matching symbolic information found.
Detected memory leaks!
Dumping objects ->
C:\temp\TstLeaks\TstLeaks.cpp(39) : {155} normal block at 0x00324618, 4 bytes long.
 Data: <    > CD CD CD CD
C:\temp\TstLeaks\TstLeaks.cpp(39) : {154} normal block at 0x003245D0, 4 bytes long.
[..]
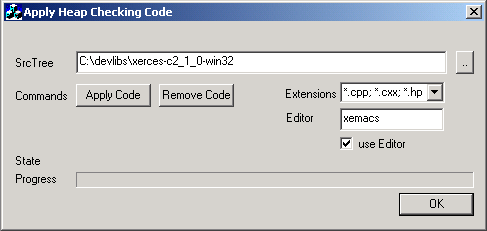
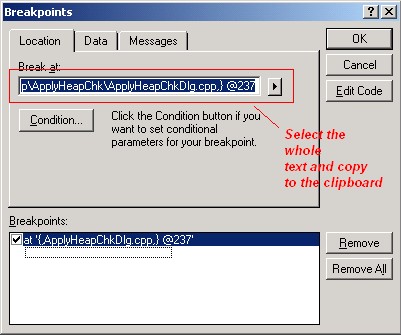
If you do not have all of the source code modified you only get the allocation number (in our case 155 and 154).. But you can use _CrtSetBreakAlloc() at the beginning of the program with that number. Sometimes the allocation is in a global class instance or static instance or in a DLL and the allocation already happend when your _CrtSetBreakAlloc() line is reached; Then you may have to do this earlier, f.e. in DLLMain(). A little helper applicationI have quickly written a little helper app to automatically append (or remove) the leak checking code recursively to a sourcecode folder. Always use this on a copy, never on the original sourcecode, of course!!! I do not take responsibility in any case. This took me only 1 1/2 h, so please be gracious: It simply looks for the last line that looks like an #include <header> line and then inserts the code. Chances are high this is a different #include that really includes code segments. Anyway during compilation you will catch this error. Then you can simply move the code up to the correct position. This tool was a tradeoff between development time and needed functionality. If the app does not know how to handle a .cpp file, it starts an editor if wanted. There you can mark the file as uninteresting ( //===HEAPIGNORE=== anywhere in the file ) or give a hint to where to put the code ( //===HEAPHINT=== ).  This piece of software is in the public domain, this is the licence for it. You have to accept it before downloading the software. Download sourcecode. There is a neat application called vld (Visual leak detector), that does a much nicer job than this app. Check out this article on Codeproject. Heap CorruptionYou can Use _CrtCheckMemory() to check the heap at any time in your program. assert( _CrtCheckMemory() ); looks like a safe bet. Try this before and after calling a specific block of code. If you experience heap corruption, the runtime will inform you - this does not always mean you have written beyond array bounds or corrupted code "directly". (the standad way). You can get a heap corruption on delete if you mixed different C runtime libraries into your .exe. f.e. if the object was created f.e. with MSVCRT (multithreaded release runtime) and deleted again with MSVCRTD (multithreaded debug runtime). Even if you use the same runtime library, sometimes due to DLL or lib linkage the other runtime library will be in your code aswell. Use depends to ensure you have the correct DLL runtime library (i.e. only one). If not, you really, really need to set the /nodefaultlib:"x.LIB" linker option for all the runtime libraries that get in your way: you will also get an appropriate linker warning. Use the _CRTDBG_CHECK_ALWAYS_DF flag for _CrtSetDbgFlag() to make the runtime check the heap on every allocation/deallocation. Note: the runtime barfs upon corruption, but the corruption doesn't really have to do anything with the current allocation / deallocation. If you have used the #define trick described previously, you will get the data type and allocation aswell - else, you only have the address. Loaded symbols for 'C:\WINDOWS\system32\MSVCRTD.DLL' Loaded symbols for 'C:\WINDOWS\system32\MSVCP60D.DLL' memory check error at 0x00324AF8 = 0x0A, should be 0xFD. memory check error at 0x00324AF9 = 0x00, should be 0xFD. memory check error at 0x00324AFA = 0x00, should be 0xFD. memory check error at 0x00324AFB = 0x00, should be 0xFD. DAMAGE: after Normal block (#58) at 0x00324AD0. Normal allocated at file c:\temp\stl1\stl1.cpp(60). Normal located at 0x00324AD0 is 40 bytes long. If you only have the address you can take advantage of the fact that virtual addresses normally stay quite stable in between debugger invocations. You can set a debugger breakpoint (type data, second tab). At program begin the breakpoint will not be able to be set (probably the heap is not initialized yet). When your app is running you normally can turn on the data breakpoint again. At least when the destructor is being called you will get your breakpoint. General DebuggingA breakpoint in a different .dswIf you have 2 .dsw project and both share the same code (DLLs for example) and you want to set an breakpoint at a specific point but you have the wrong .dsw open, you can try the following trick to copy the breakpoint over to the other .dsw. simply set it in the first, then copy and paste the breakpoint definition from one .dsw to the other. You can open the breakpoint dialog on both msdev windows and the use cut and paste within the CEdit type control.  Breaking with DebugBreak()Often msdev refuses to activate a breakpoint in a library which is actually used via ::LoadLibrary ( for example drivers). At startup, msdev assumes the library is not loaded and cannot set the breakpoint. You can simply type DebugBreak(); in the driver code and fire up your app. When the line is hit, the debugger will break into the process. The only problem is, at that point you are in NTDLL.DLL and in assembly code. Now you have to press F11 twice to step over and out of the assembly code (and NTDLL.dll) , then double click on the callstack to get the sourcecode. Et voila, you have your breakpoint. Important! When not called from within msdev, DebugBreak() looks, smells and behaves like a crash. Do not forget to remove it again. Debug information in release codeYou can add debug information in release mode - then you get the callstack and the sourcecode - but do not trust the variable display. The following project settings have to be applied to release builds:
see also this msdn article. This other article is also particulariy interesting Use Process Explorer to analyze threadsProcess explorer from sysinternals takes advantage of .pdb files and gives you a somehow-realtime display of your call stacks (with method names) of all of your application's threads and the CPU usage per thread! Overall a phantastic tool. Remote debugger for neworked appsRecently I have been busy developing a med. sized client/server application and was quite astonished about how easy it was to setup remote debugging for a networked app. It is very stable and very powerful. You do not have to copy the sourcecode. Basically you just keep the monitor running on another machine. You build client and server on one machine (your developer machine). You use robocopy to quickly copy the binaries (including .pdb) after one build to the other machine. You fire up remote debugging to debug both client and server from 2 distinct msdev sessions from your developer machine (the server will be started on the remote machine) and have total control. You can use the subst command to create virtual drives to keep the path-mapping problem (where is the dll on the other machine) at a reasonable level. You end up keep pressing escape on debugging invocations a lot because system DLLs from 2 systems do not match and you get a messagebox on every debugger session, but that is ok. Read this great article about remote debugging here. LoggingI really like this one because it is so simple and effective. I use this one in conjuction with unix "tail" utility. Here is the small code snippet:
// ------------------------------------------------------------------
// --- a minimalistic threadsafe logger, win32 version ---
// ------------------------------------------------------------------

#ifdef _WIN32
   #include "windows.h"
#endif
#include "assert.h"
#include "stdio.h"

#define _ ,

FILE*    g_pFileLog;
HANDLE   g_pLockLog;

#define QLOG_OPEN( sFile )                                          \
{                                                                   \
    g_pFileLog = fopen( sFile, "a" );                               \
    g_pLockLog = CreateMutex( NULL, NULL, NULL );                   \
    assert( g_pFileLog && g_pLockLog );                             \
}
#define QLOG_CLOSE()                                                \
{                                                                   \
    fclose( g_pFileLog );                                           \
    CloseHandle( g_pLockLog );                                      \
}
#define QLOG( args )                                                \
{                                                                   \
    WaitForSingleObject( g_pLockLog, INFINITE );                    \
    fprintf( g_pFileLog, args );                                    \
    fflush( g_pFileLog );                                           \
    ReleaseMutex( g_pLockLog );                                     \
}

// ------------------------------------------------------------------
// --- test app ---
// ------------------------------------------------------------------
int main(int argc, char* argv[])
{
    QLOG_OPEN( "log.txt" );
    long lID        = 666;
    long lAge       = 12;
    char cbName[]   = { "I am a name" };
    QLOG( "\nThe ID is: %d, the number is: %d, the name is: %s " \
            _ lID _ lAge _ &cbName[0] );
    QLOG_CLOSE();
    return 0;
}
The main trick is the #define _ , " which removes the requirement for a varargs macro support (which is available with recent compiler versions of gcc or MSVC). It is trivial to remove the win32 dependant stuff and log to something different by utilizing sprintf or a variation. In fact, in this fprintf case the mutex lock is not needed on platforms where threadsafe runtime libraries are available. Changes
|


